

Financial Performance and Profitability
-
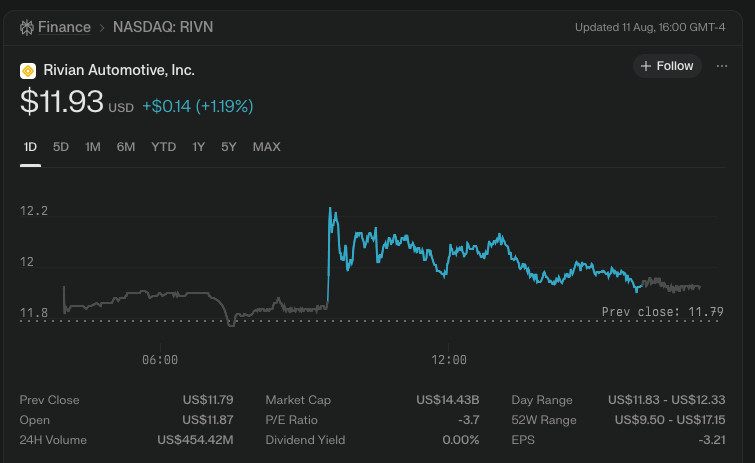
Revenue (Q1 2025): $1.24 billion
-
Net Loss (Q1 2025): $541 million (improved from $1.45 billion in prior year)
-
Adjusted EBITDA (Q1 2025): -$329 million
-
Free Cash Flow: -$526 million, clearly improved year-over-year
-
Gross Profit: $206 million in Q1 2025, second consecutive quarter of profitability, highest to date
-
Operating Margin: Still negative but improving with cost reductions in vehicle components
-
Capital Expenditure Forecast: Increased to $1.8–$1.9 billion for 2025, partly due to tariff impacts and expansion plans
-
Cash on Hand: Approximately $7.2 billion as of mid-2025, strengthened by $1 billion investment from Volkswagen Group
Vehicle Sales and Production (Revised)
| Region | Revenue & Shipments Focus | Notes |
|---|---|---|
| United States | Core market; key deliveries recorded | Production paused early 2025 for R2 model update |
| Global Deliveries | Expected 40,000 to 46,000 vehicles in 2025 | Down from previous target of 57,000 |
-
Q1 Production: 14,611 vehicles (R1T, R1S, delivery vans)
-
Q1 Deliveries: 8,640 vehicles; Q2 deliveries improved to 10,661
-
Sales Decline: Approximately 23% year-over-year decline in Q2 due to tariff effects and production adjustments
-
Focus: Transition to 2026 model year vehicles and ramp-up of smaller R2 SUV planned for 2026 launch
Regional and Global Sales Performance
-
Rivian's sales remain concentrated in the U.S., with growing interest internationally through partnerships but limited standalone presence.
-
The company is balancing production slowdowns with a strategic pivot towards more affordable and mass-market EV offerings (R2).
Profitability and Cost Factors
-
Cost of goods sold per vehicle has been reduced by approximately $22,600 year-over-year through efficiency gains.
-
Increased capital spending due to tariffs and technology investments are challenging near-term profitability.
-
Strategic partnership with Volkswagen unlocks funding and technology synergies to improve cost structures and scale.
Debt and Liquidity
-
Strong liquidity position with around $7.2 billion cash and short-term investments bolstered by strategic equity injection.
-
Debt levels and net losses remain high but are trending towards improvement with scaled production and delivery growth anticipated.
Best Selling Vehicles: Overview and Profit/Loss Status
| Model | Estimated Units Sold 2025 | YoY Change (%) |
|---|---|---|
| R1T Pickup | Majority of current sales | Decline due to production constraints |
| R1S SUV | Significant plus delivery vans | Similar decline |
| Upcoming R2 SUV | To be launched in 2026 | Target for future growth |
-
R1T and R1S remain core revenue and profit contributors.
-
R2 is positioned as a more affordable, smaller SUV expected to boost volumes and market reach starting 2026.
Weakest Performers and Segment Underperformance
-
Delivery vans and R1 models face headwinds from tariffs and supply constraints.
-
Sales volumes lower than initial targets for 2025 due to external macro risks and operational pauses.
Key Financial and Operational Metrics
| Metric | Value | Notes |
|---|---|---|
| Gross Margin (%) | Positive to low teens | Reached with consecutive quarterly gross profits |
| R&D Spend | $1.8 billion (forecast) | Focused on new vehicle platforms and autonomy |
| Capex | $1.8–$1.9 billion | Increased due to tariffs and expansion plans |
| Cash on Hand | $7.2 billion | Strong liquidity position |
| Adjusted EBITDA | Negative but improving | Forecasted losses narrowing in 2025 |
Industry Outlook and Strategic Focus
-
Market demand for electric adventure SUVs remains competitive but growing.
-
Rivian is focusing on ramping production efficiency, expanding product portfolio with R2, and leveraging JV with Volkswagen for tech and cost benefits.
-
Risks include tariff uncertainty, supply chain constraints, and slower-than-expected demand recovery.
-
The company aims to achieve adjusted profitability improvements and reach mass-market segments as key strategic goals through 2026.
Key Takeaways
-
Rivian’s 2025 is a transition year characterized by improved gross profits but ongoing net losses amid supply and tariff challenges.
-
Strategic Volkswagen investment bolsters balance sheet and technology development capabilities.
-
Production adjustments to align with new model introductions (R2) will temporarily affect volumes.
-
Focus on cost reduction, product diversification, and market expansion is poised to drive medium-term growth.
Sources
The overview of Company’s financial and operational performance was compiled primarily from the following authoritative sources:
-
Rivian Q1 and Q2 2025 Financial Reports and Press Releases
-
CEO and CFO Commentary (Investor Webcasts and Interviews)
-
Market Analysis from Electrek, CNBC, and EV.com
-
Official filings and financial presentations
These sources together offer the most accurate, up-to-date, and detailed insights into Rivian’s financial condition, segmental performance, and strategic outlook for 2025 without reliance on third-party aggregated data.
Summary
Rivian’s 2025 financial report reflects a company transitioning through production challenges, tariff impacts, and strategic growth with improving gross profitability yet sustained net losses. The partnership with Volkswagen and a shift toward new models, notably the more affordable R2 SUV, underpin the company’s strategy to enhance competitiveness and scale. While delivery volumes are currently below initial targets, Rivian’s operational improvements and funding support suggest cautious optimism for growth and profitability stabilization into 2026.