
Tag: Interactive Graphics
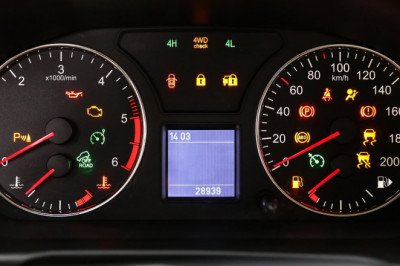
How well do you know your car dashboard warning lights? Take this tricky quiz to find out - only 4% of motorists know them all
Some 46% of motorists - who represent 23m licence holders in Britain - can't correctly name half of the symbols that show up on the instrument cluster.

Interactive map reveals areas with most mis-sold car finance claims: Find out if YOU could be one of 1.4million drivers owed compensation over 'secret' commission payments
Drivers across Britain gearing up compensation war have submitted a staggering 1.4m claims after being mis-sold car finance - as a new map today laid bare the scale of the payments fiasco.
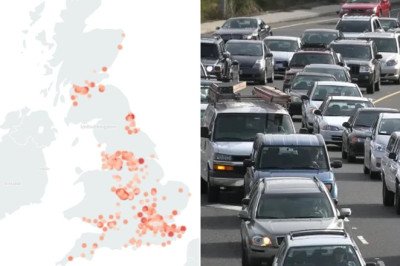
Uninsured driver hotspots EXPOSED: Interactive map lays bare 500 worst-offending areas... so is yours one of them?
The Motor Insurers' Bureau, which pays out claims for victims of uninsured driver and hit-and-run crashes, has released figures showing where these incidents occur most often.
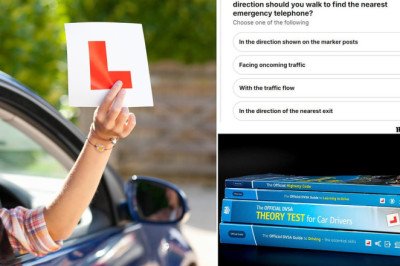
Only 1% of drivers answered these five car theory test questions correctly - how many can you get right?
Results from a recent poll found that only 18 out of 2,000 licence holders could provided the correct answer to all five questions - a lousy success rate of just 0.9%.
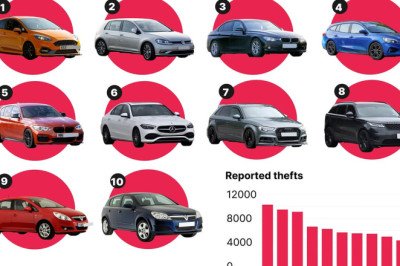
Britain's most stolen cars revealed - so is YOURS one of them?
The Ford Fiesta is the most stolen car in the UK, figures suggest. Almost 10,350 were stolen between January 2018 and July this year, according to data collected by Confused.com.

What is the most popular car in YOUR postcode? From Range Rovers in leafy Chelsea to Citroens in Cornwall, our interactive map reveals all...
Motorists living in urban areas miles away from the countryside in areas such as Knightsbridge and Mayfair are more likely to own high-end SUVs such as Range Rovers than those in the country.